
How to Use Heatmaps to Improve Website’s UX (Updated 2025)
Heatmaps are incredibly useful tools for improving the user experience (UX) of your website. They visually show how users interact with your site by displaying clicks, scrolls, and mouse movements. In this guide, we’ll explore how you can use heatmaps to understand user behavior better and make smart decisions to make your website easier and more enjoyable to use.
After reading this article, you’ll know exactly how to use heatmaps to make your website’s UX better. You’ll learn how to look at user behavior, find areas that need improvement, and use data to make your site easier to use and more satisfying for your visitors. With this knowledge, you’ll be able to create a website that’s more engaging and user-friendly, meeting the needs of your audience more effectively.
What is a Heatmap in UX Design?

A heat map is like a colorful map overlay that helps visualize how much of something is in different areas. For instance, if you wanted to show the population density of a town, you could use a heat map. Darker colors on the map would represent areas with more people, while lighter colors would indicate areas with fewer people.
Imagine you’re trying to understand how crowded different parts of your town are. Instead of using confusing pie charts or bar graphs, you could simply look at a heat map overlaid on a map of your town. This heat map would instantly show you which areas are bustling with activity and which ones are quieter.
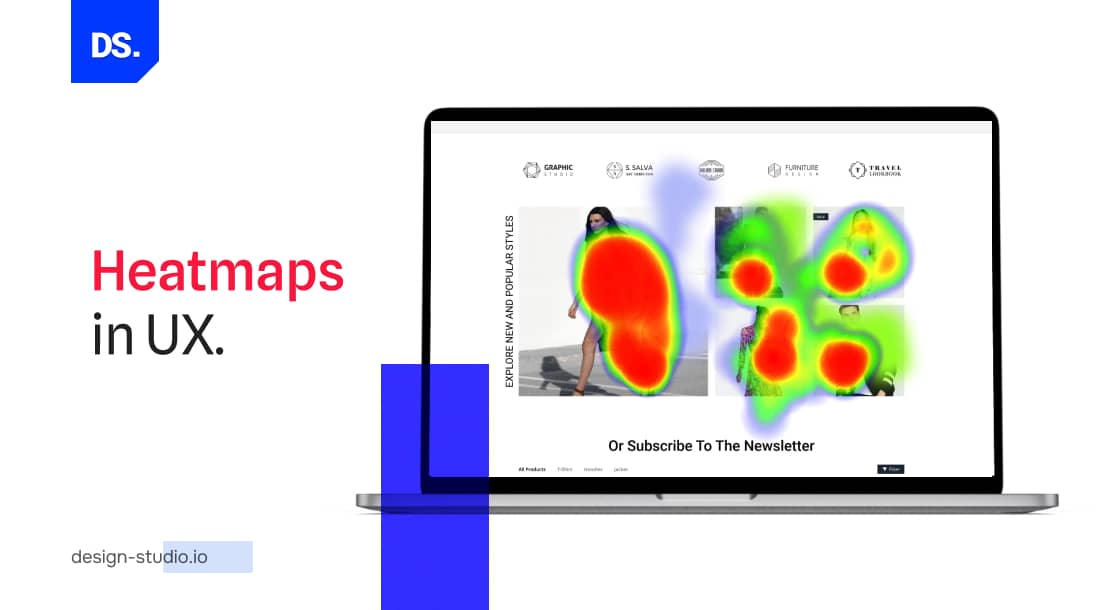
In UX design, heatmaps are like special glasses that help designers see how people use websites. They collect and study all sorts of actions users take, like clicking, scrolling, and moving their mouse. The colors on the heatmap show where users are most active: warm colors like red or orange mean lots of action, while cool colors like green or blue mean less
By looking at the heatmap, designers can spot popular areas that need to stay the same or get better. They can also find parts of the website that aren’t getting much attention and figure out how to improve them. Heatmaps give designers a clear picture of where to focus their efforts to make websites easier and more enjoyable for everyone.
Heatmaps directly reveal areas of high or low engagement on a website. The color-coding enables analysts to identify which sections of their website are popular, which sections are not visited enough, and which sections cause users to exit the website. They can use this info to make targeted improvements to their website design.
How to use Heatmaps in your Website’s UX
Making the most of heatmaps means following a clear plan, with specific steps to understand how users behave on your site and improve their experience by analyzing their interactions in detail. Here are the steps to effectively optimize your website for better engagement:
1. Selection of the Appropriate Heatmap Tool
Selecting an appropriate heatmap tool is paramount. Consider factors such as your specific needs, budget, and desired features like click tracking, scroll mapping, and session recording. These features allow for a thorough analysis of user interactions, providing valuable insights into how visitors engage with your site.
2. Defining Clear and Precise Objectives for Analysis
Before embarking on heatmap analysis, it’s essential to define your goals clearly. Determine the specific aspects of user behavior you want to explore, whether it’s understanding navigation patterns, identifying popular content, or improving the effectiveness of call-to-action buttons. Having well-defined objectives is crucial for guiding your heatmap analysis, ensuring that you uncover actionable insights with precision and clarity. This clarity helps you focus your efforts effectively, maximizing the value of the insights you extract from the data.
3. Implementation of Heatmap Tracking Code on Your Website
Installing the heatmap tracking code on your website marks the initial stage of data collection for analysis. This foundational step is crucial as it establishes the framework for collecting vital data points on user engagements. By seamlessly integrating the tracking code across all relevant pages of your website, you ensure the accurate capture of user behavior metrics. This meticulous implementation forms the cornerstone of your heatmap analysis, providing a reliable foundation for deriving meaningful insights to inform your website optimization efforts.
4. Examination and Interpretation of User Clicks and Interactions
Delve into the heatmap data to analyze user clicks and interactions on your website. Identify which areas users are clicking the most, such as popular links, buttons, and navigation elements. By understanding user interaction patterns, you can optimize the placement and design of these elements to enhance the overall user experience.
5. Investigation of User Scroll Behavior Across Website Pages
Explore how users navigate through your website by analyzing scroll behavior using scroll maps. Determine how far users scroll down each page and identify areas where they may lose interest. Adjusting content layout or length based on scroll behavior insights can help maintain user engagement and encourage further exploration of your website.
6. Understanding User Attention and Interaction Patterns through Mouse Movements
Study mouse movement heatmaps to gain insights into user attention and interaction patterns. Pay attention to areas where users hover their mouse cursor, as these may indicate points of interest or confusion. Understanding how users engage with different elements of your website through mouse movements can inform design decisions and improve overall usability.
7. Segmentation and Comparative Analysis of Heatmap Data
Break down heatmap data by user demographics, device types, or traffic sources to uncover specific behavior trends. Comparing different segments allows you to identify variations in user interaction and tailor your website’s user experience accordingly. By understanding the preferences and behaviors of different user groups, you can optimize your website to better meet their needs.
8. Continuous Improvement and Testing Based on Insights
Implement changes based on heatmap insights and continuously monitor their impact on user behavior and website performance. Conduct A/B testing and iterative improvements to refine your website design and content, optimizing the user experience over time. By consistently testing and refining based on heatmap data, you can ensure that your website evolves to meet the changing needs and preferences of your users.
Benefits of Using Heatmaps in UX Design
Using heatmaps has many benefits for making your website UX better and giving users a good user experience. Heatmaps show you how users click, scroll, and move their mouse on your site. This helps website owners and designers decide where to put things on the site to make it easier for users. By using heatmaps, you can make changes that make people more interested in your site and more likely to do what you want them to do. This means your website is more helpful and enjoyable for users
Clear and Easy to See How Users Act
Heatmaps show a clear picture of how people use your website. They use colors to show which parts are clicked the most and how far people scroll down. This gives you insights into what aspects of your site resonate with users and what areas may need improvement
Make Your Website Better for Each User
Heatmaps help you make your website better for each person who visits. By seeing where people click and how they move around, you can change things to make it easier for them to find what they want.
Decide What Changes to Make with Good Info
Heatmaps give you good information about how people use your website. This helps you decide what changes to make to make it work better for them. For example, if people aren’t clicking on something important, you can move it to a better place.
Use Time and Money Wisely to Get More Visitors
Heatmaps help you use your time and money in the right places. Instead of trying to fix everything on your website, you can focus on the parts that need the most help. This way, you get more people to visit your site without wasting time or money on things that don’t matter as much.
Work Better Together with Your Team
Heatmaps make it easy for everyone on your team to work together. By sharing heatmap pictures, everyone can see what’s happening on your website and come up with ideas to make it better. This helps everyone stay on the same page and work together to make your website the best it can be.
Keep Making Your Website Better over Time
Heatmaps help you keep making your website better as time goes on. By looking at the heatmap data regularly, you can see what’s working and what’s not. This helps you make small changes over time to make sure your website stays up-to-date and keeps people interested.
The Different Types of Heatmaps in UX Research
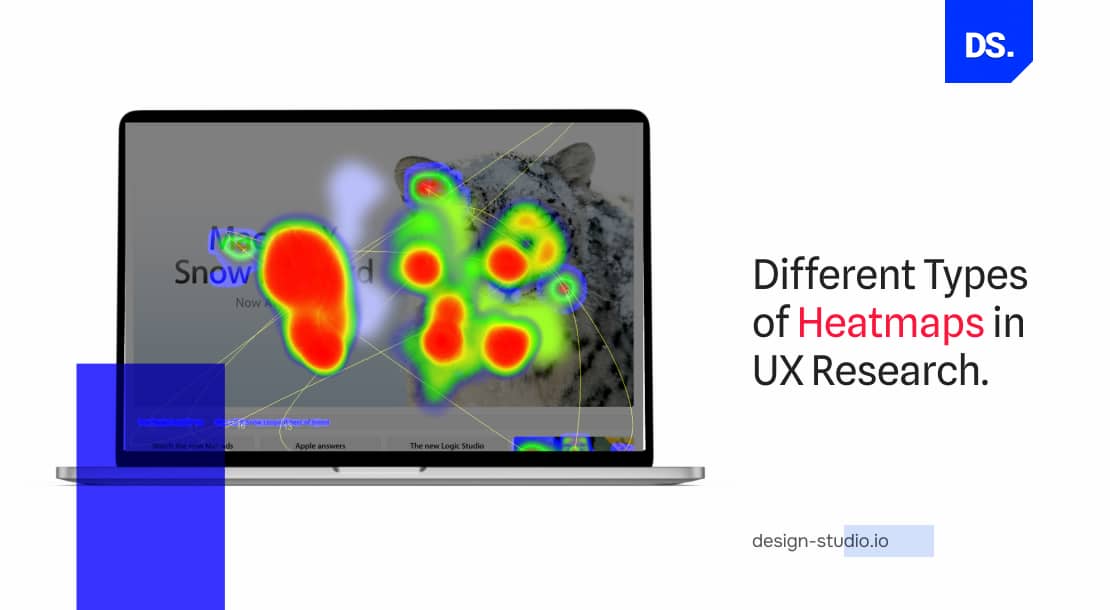
There are 3 types of heatmaps that UX researchers use: each tracks a specific type of user behavior:
Click Heatmaps
Click heatmaps or ‘click-maps’ help visualize the sections of a website that users click or tap on. UX designers/researchers can use this info to discover which clickable elements on the website are or are not being clicked.
They can also use it to determine misclicks, dead clicks, and rage clicks. These types of clicks are registered when users click on noninteractive design elements, assuming that they’re interactive.
Scroll Heatmaps
Scroll heatmaps or ‘scroll-maps’ help visualize the most scrolled regions on a website. UX researchers can use this info to determine if users are scrolling across the website to discover or click on important interactive design elements and calls-to-action (CTA) buttons.
They can also use ‘scroll-maps’ to determine which website sections are the least visited. These maps also reveal which sections of the website confuse users and compel them to end their scrolling sessions.
Mouse Movement Heatmaps
Visitors often hover their mouse (pointers) on website sections without clicking anything. Mouse movement heatmaps, i.e., ‘hover maps’ reveal this user behavior. Hover maps are not popular tools in the world of UX research because they can often be misleading.
Visitors often rest their pointers in blank locations on websites, as they read content. These actions are recorded on hover maps and they do not reveal any areas of user interest.
UX Heatmap Tools You Can Use
UX heatmap tools are vital for enhancing user experience (UX) on websites and digital platforms. These tools capture and analyze user interactions, offering valuable insights to improve usability and satisfaction. Here are some of the most popular UX heatmap tools:
Hotjar
Hotjar offers a comprehensive suite of UX analytics tools, including heatmaps, session recordings, surveys, and feedback forms. It helps visualize user behavior and understand interactions on websites.
FullStory
FullStory provides detailed session replays, heatmaps, and analytics to gain insights into user behavior. It offers advanced features for understanding user interactions and optimizing website performance.
Lucky Orange LLC
Lucky Orange LLC offers real-time analytics, heatmaps, and live chat support to track user behavior and improve website performance. It helps identify usability issues and optimize conversion funnels for better UX.
Mouseflow
Mouseflow provides session replay, heatmaps, and form analytics to track user interactions. It offers insights into user behavior, facilitating optimization and overall UX improvement.
Smartlook
Smartlook offers heatmaps, session replays, and event tracking to understand user behavior. It provides detailed insights into user interactions, helping optimize website performance and improve UX.
Crazy Egg
Crazy Egg provides heatmaps, scroll maps, and user recordings to understand user behavior effectively. It also features A/B testing and personalized recommendations to enhance conversion rates and UX.
Contentsquare
Contentsquare offers advanced UX analytics tools, including heatmaps, session recordings, and AI-powered insights. It helps businesses understand user behavior and optimize digital experiences for better conversion and engagement.
Microsoft Clarity
Microsoft Clarity provides heatmaps, session replays, and website analytics to understand user behavior. It offers insights into user interactions, helping improve website usability and overall UX.
Attention Insight
Attention Insight offers heatmap analysis and predictive analytics to optimize visual content. It helps businesses understand how users interact with images and visuals to improve engagement and conversion.
Use Heatmaps with Other UX Research Tools
Heatmaps offer plenty of useful insights. But, they are even more insightful when used in conjunction with other UX research tools. Here are some examples:
| Heatmaps + UX Research Tool | Why Use This Combination? | Example of Using this UX Research Combination |
| Heatmaps & Traditional Web Analytics | Heatmaps offer qualitative data about user behavior: where visitors are clicking/scrolling/hovering, etc.Traditional analytics tools (like Google Analytics) offer quantitative data: number of page views, bounce rates, traffic sources, etc. Combine the two and you will get a clear understanding of why users are behaving in certain ways. You will also get to identify important areas for design improvements. | Let us say you have a homepage with a high bounce rate:Heatmaps reveal where users are clicking/scrolling. You notice that many users are leaving the homepage right after clicking on the navigation bar.You then assess the “Exit Links” report in Google Analytics. This report will reveal the last link visitors click on before exiting your website.You can use the combination of this info to fix broken or dead links in the navigation bar on your homepage. |
| Heatmaps and Session Recordings | While heatmaps aggregate data from all website visitors, session recordings demonstrate how individual users interact with your website.You can use heatmaps to identify areas of low engagement on your website.Then, you can watch session recordings of individual users who’ve quit your site after visiting the ‘cold’ areas of your website. | Let us say your eCommerce site has a checkout page with a high abandonment rate:You use the session recordings to watch how users interact with the underperforming checkout page.You discover that multiple users have failed to complete a specific form.You use heatmaps to see how many users have faced the same issue.You find out that the form section on the checkout page is confusing to multiple users.You make appropriate design changes to the form section and make it easier for users to fill up. |
| Heatmaps and On-Page Feedback | On-page feedback tools allow web designers to collect qualitative feedback from visitors. This qualitative data can be combined with the data heatmaps provide to make targeted design changes. | Let us say you have used heatmaps to identify 2 problem regions on your website:You make apt design changes to fix the two problem regions.Then, you use on-page feedback tools to ask users if the design changes have improved their user experiences.You keep using the feedback from visitors to gradually eliminate all ‘problem regions’ from your site. |
Start Using Heatmaps in UX Research and Design
Heatmaps are incredibly useful UX research tools that deserve to be in every digital designer’s arsenal. If you want to unleash the power of these tools and improve your website’s UX quality, contact Design Studio UI UX now for more personalized assistance!
comments
Add comment